
Artie CDC into oleander
Peter Hicks
Want to follow along with your own database? The Artie integration guide walks through connecting Artie to oleander.
The slightly deferred data warehouse has made way for the actual real-time warehouse, thanks to modern Change Data Capture (CDC) tools that read straight off of a database's WAL (Write Ahead Log) and immediately replicate every change into a variety of destination systems. One of our favorite tools is Artie, which has a whole host of source connectors that make building a sophisticated multi-source warehouse much easier, lower risk, and more cost predictable than running your own streaming stack on something like Kafka. At oleander, we store our data in object storage via Iceberg, which just so happens to be a supported destination for Artie through the Iceberg REST catalog.

Lots of Iceberg choices
There are many places to keep your Iceberg tables, including but not limited to:
- AWS S3 Tables, now queryable straight from Aurora PostgreSQL (hot off the press)
- AWS Glue
- Snowflake Horizon
- Databricks Unity Catalog
- Lakekeeper (deploy and maintain it yourself)
With all these choices, it's important to understand what you are actually getting out of them, which at the essence is an implementation of the Iceberg REST catalog. In some cases, like Aurora PostgreSQL, you also get an embedded DuckDB that can query off of the Iceberg catalog.
S3 Tables, Glue, and Lakekeeper are catalogs, and most of them leave some or all of the following to you:
- Observability, lineage, & alerting
- Automated maintenance
- Query engines (some include one, otherwise you're on your own)
- Agent native permissioning
- An MCP server
- Unified auth for all the tools your engineers have on their laptops
- Spark automatic configuration
- Audit trails
Snowflake Horizon and Databricks Unity Catalog cover most of that list, but they're built for "big" data, when most workloads, even inside a large org, remain comparatively "small". The smallest thing you pay for is a warehouse or a cluster, billed in dreaded credits or DBUs, whether your query needs all of it or not. Snowflake, for example, bills a minimum of 60 seconds every time a warehouse starts or resumes, so even a quick read of our 1,456-row benchmark table below pays for a full minute of warehouse. oleander is right-sized instead: every query gets the engine and machine it actually needs, from DuckDB or Bloom for a quick read up to Spark for a large distributed query. That's how a maintenance run comes in at $0.06, and how an agent can make 82 small requests below to answer one question without anyone provisioning a whole cluster of warehouse compute for it.
Replicating our benchmarks
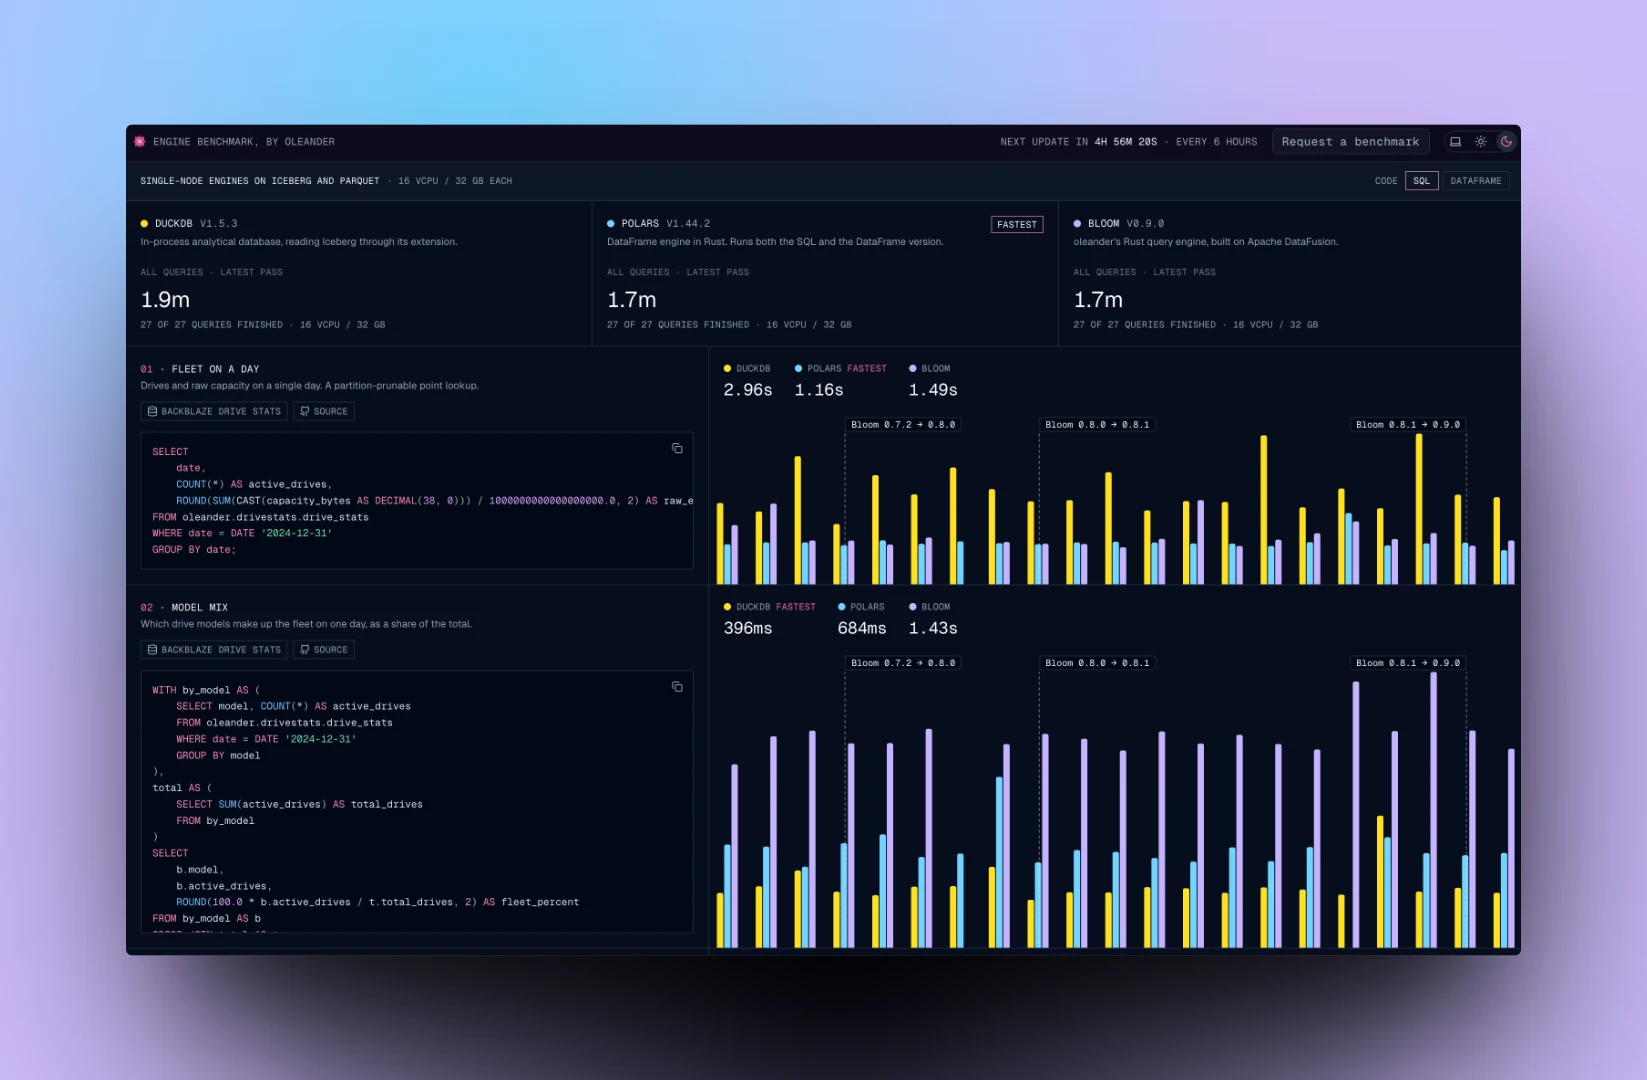
For our example, we'll be bringing the results of our single-node benchmarks (stay tuned for the distributed systems benchmarks) into our warehouse as soon as they are available. They run every 6 hours and let us (and I suppose now everyone...) know about the deltas between versions of our supported engines, run in-depth status checks on the features of each engine, and track the performance differences between them. There is no order of magnitude difference in performance since the underlying Parquet & Iceberg layers provide the same storage mechanics, but the engines do offer different developer experiences and engine specific functions. We'll explore one from DuckDB below...
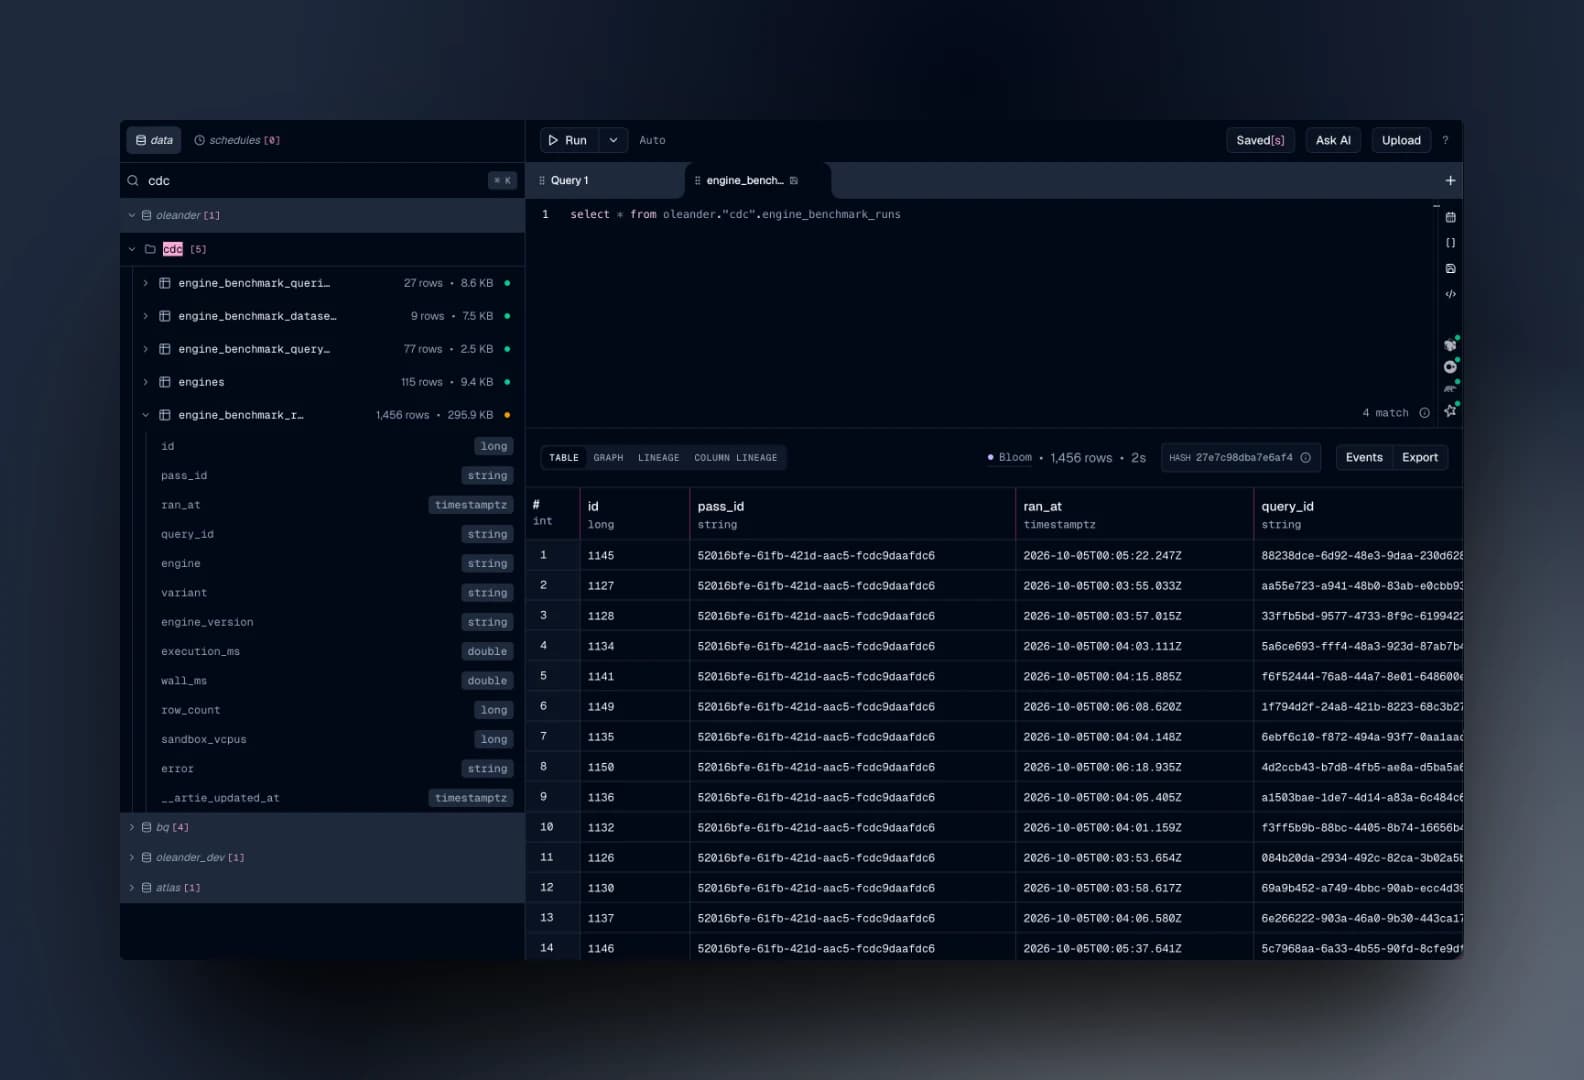
Artie lands each benchmark table in the oleander.cdc namespace, and every sync becomes another Iceberg commit. The table we care about here is engine_benchmark_runs, which gets a new batch of rows every time the benchmarks finish.
The small files problem
Since data arrives every 6 hours, each sync adds another small Parquet data file (and another manifest pointing at it). After a couple of weeks, the simplest possible query has to open a menagerie of tiny files to read 1,456 rows:
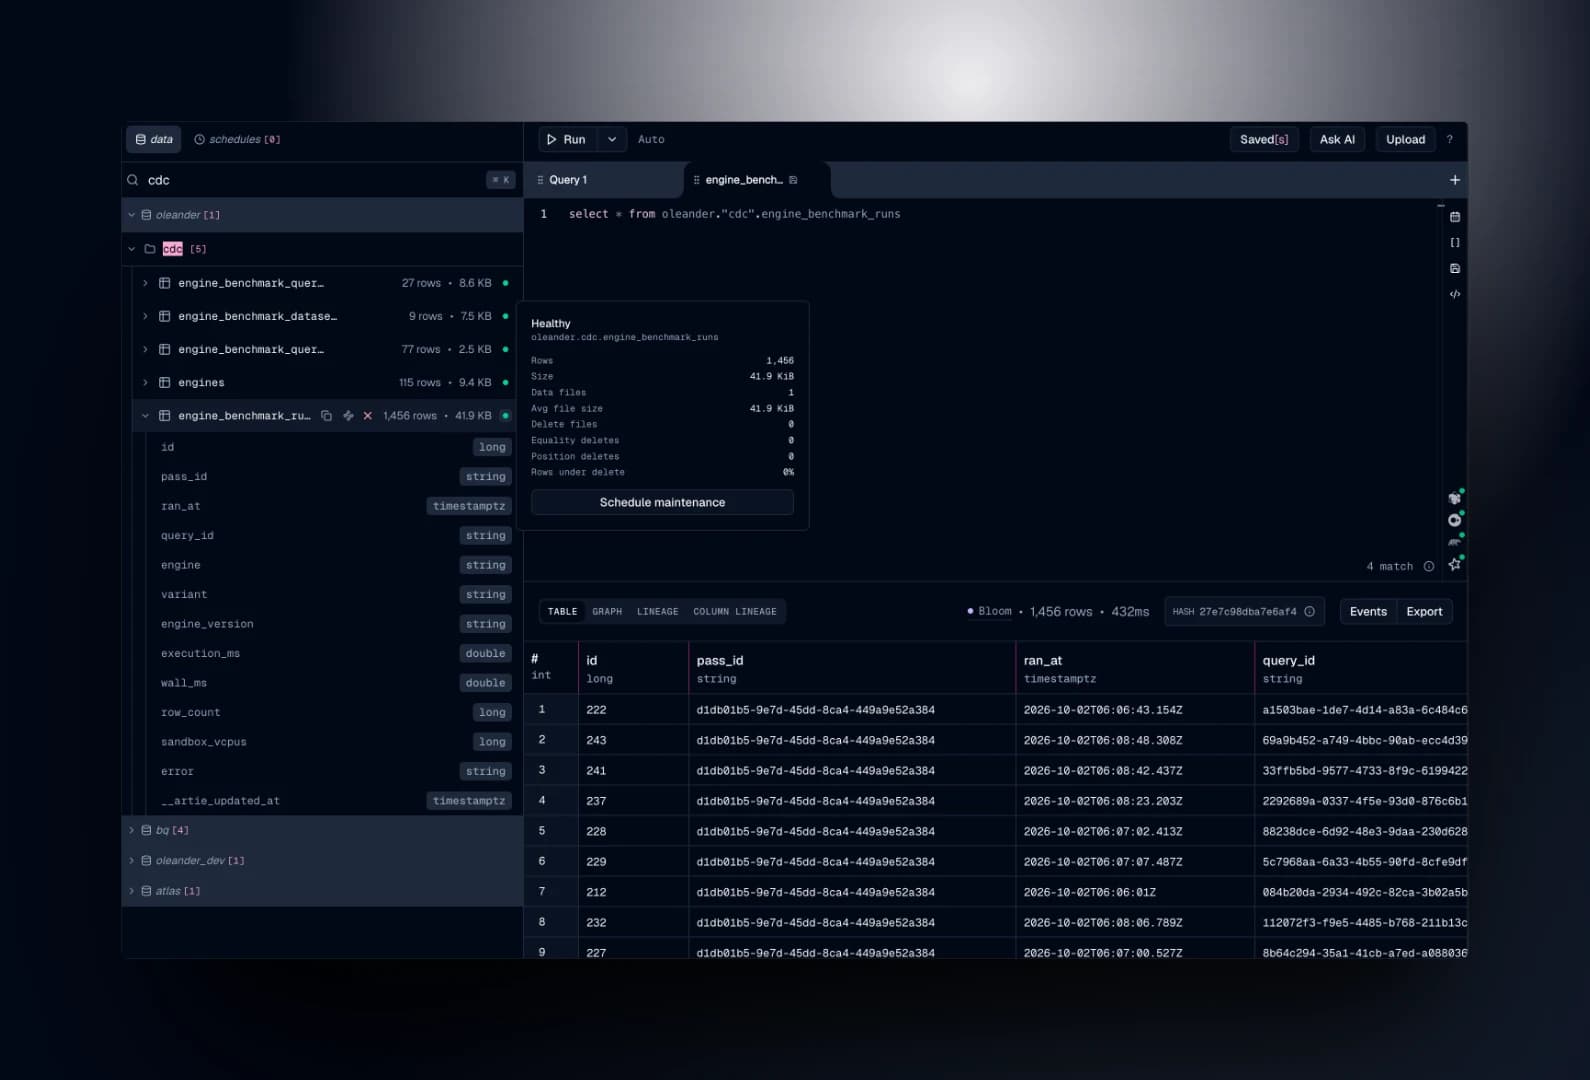
-- runs with Bloom (DataFusion)select * from oleander."cdc".engine_benchmark_runsThat took 2 seconds on Bloom. Not an unmitigated disaster, but slow for a table that I could encode into an oleander petal with a chisel, and notice the orange dot next to the table in the tree.
Let's look under the covers at what actually happened here using DuckDB's nifty iceberg_metadata helper function:
-- runs with DuckDBselect * from iceberg_metadata(oleander."cdc".engine_benchmark_runs)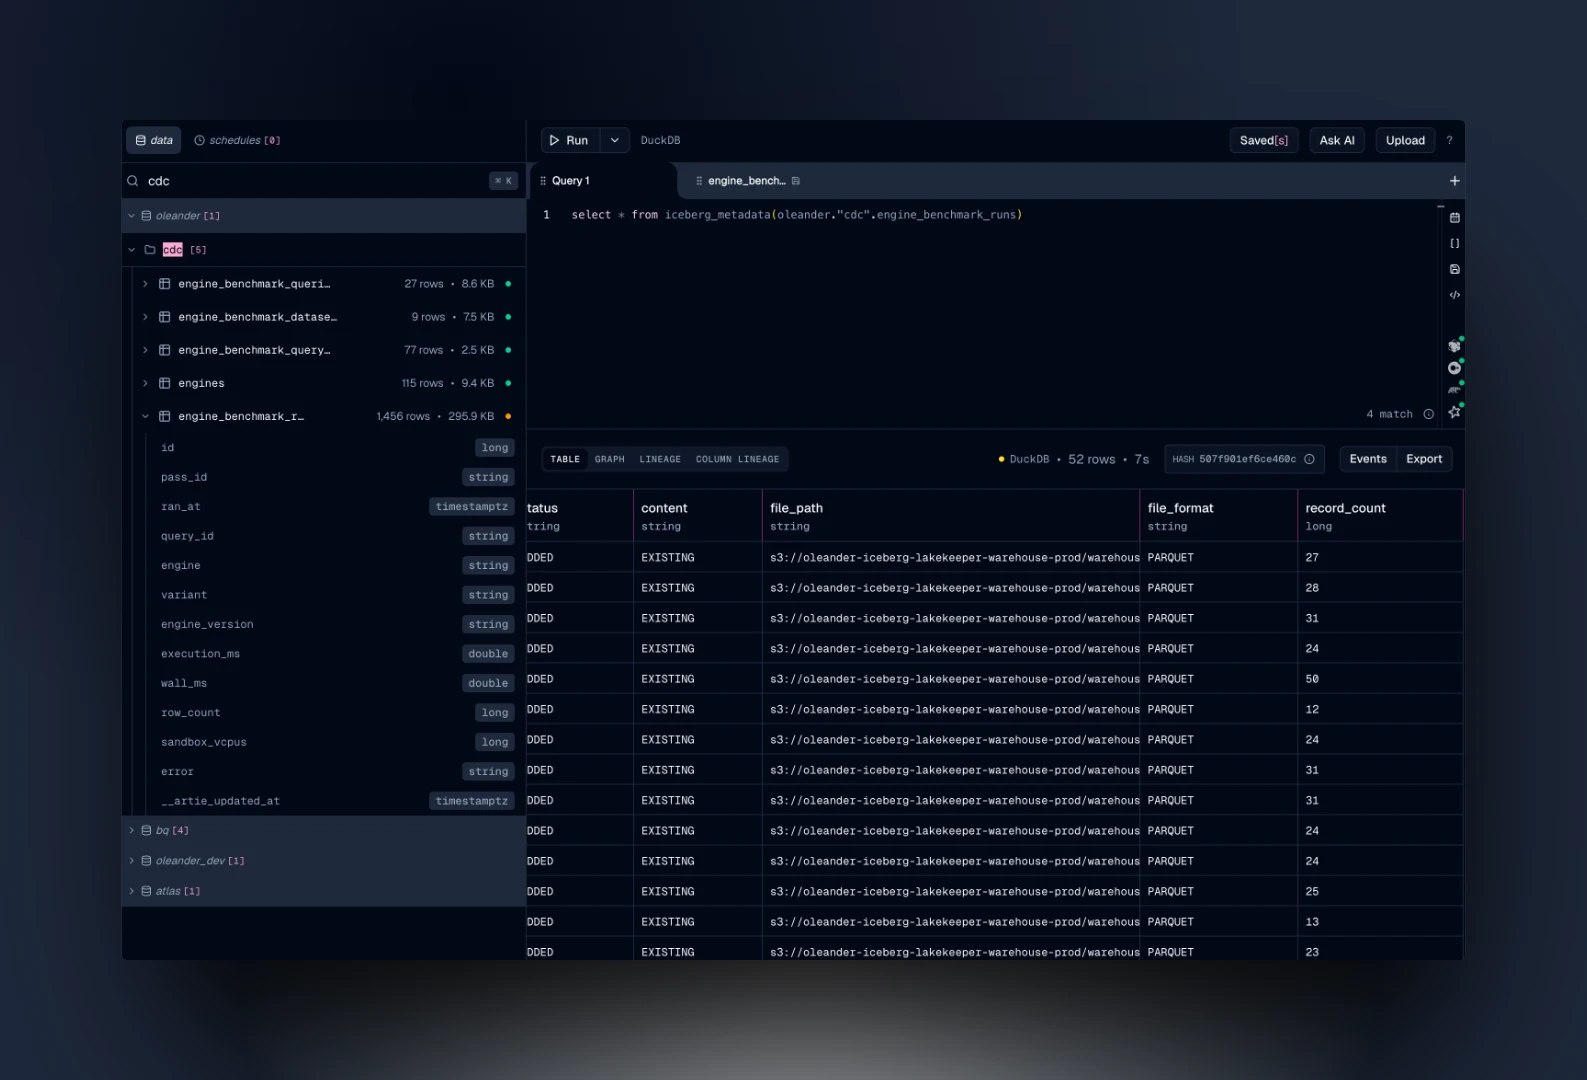
The result set contains the actual object storage locations of the manifests and their corresponding Parquet files. Right now, we're suffering from the much reviled small files problem:
- 52 data files, each referenced by its own manifest
- 1,456 rows in total, so about 28 rows per file, with the smallest files holding just 5 rows (We kept adding new benchmark queries over time)
- An average file size of 5.7 KiB, against a 32 MiB target (This is configurable)
Every one of those files carries its own Parquet footer, schema, and column statistics, and every one of them is a separate object storage request at read time. The engine spends more time opening files than reading data. Yikes...
Scheduling maintenance
oleander watches the shape of every Iceberg table and flags the ones that need attention. Hovering the orange dot gives you the diagnosis and a button to fix it:
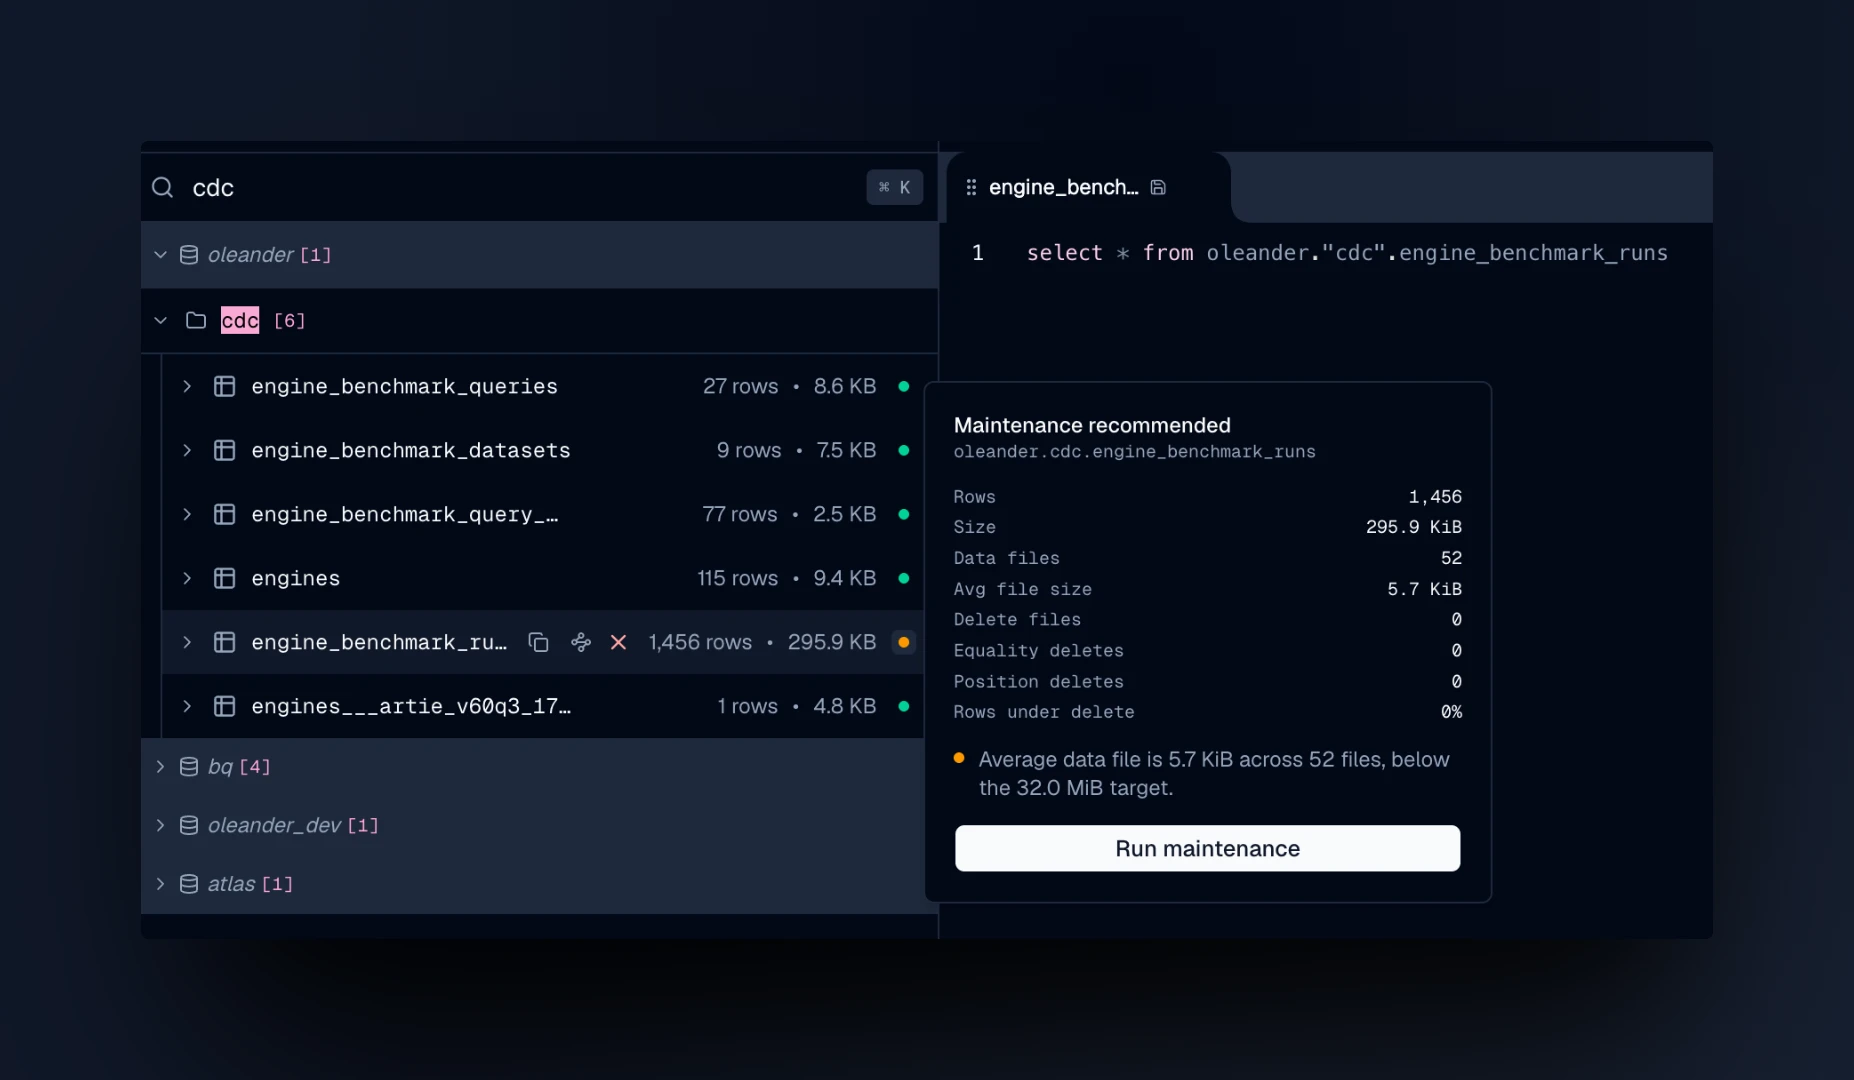
There are no equality or position deletes on this table (Artie is appending the benchmark results, not rewriting them), so the fix is pure compaction. Run maintenance submits a Spark job against the table that runs two Iceberg procedures:
rewrite_data_filesbin-packs the small Parquet files into files closer to the target sizeexpire_snapshotsdrops the old snapshots that still reference the small files, so the storage is actually reclaimed
Rewriting without expiring leaves the old files referenced by previous snapshots, which reclaims nothing, so we run the two together.
Like every other job in oleander, the maintenance run shows up with a full trace and lineage. The whole thing took 40 seconds, most of which is Spark starting it's serverless compute instance:
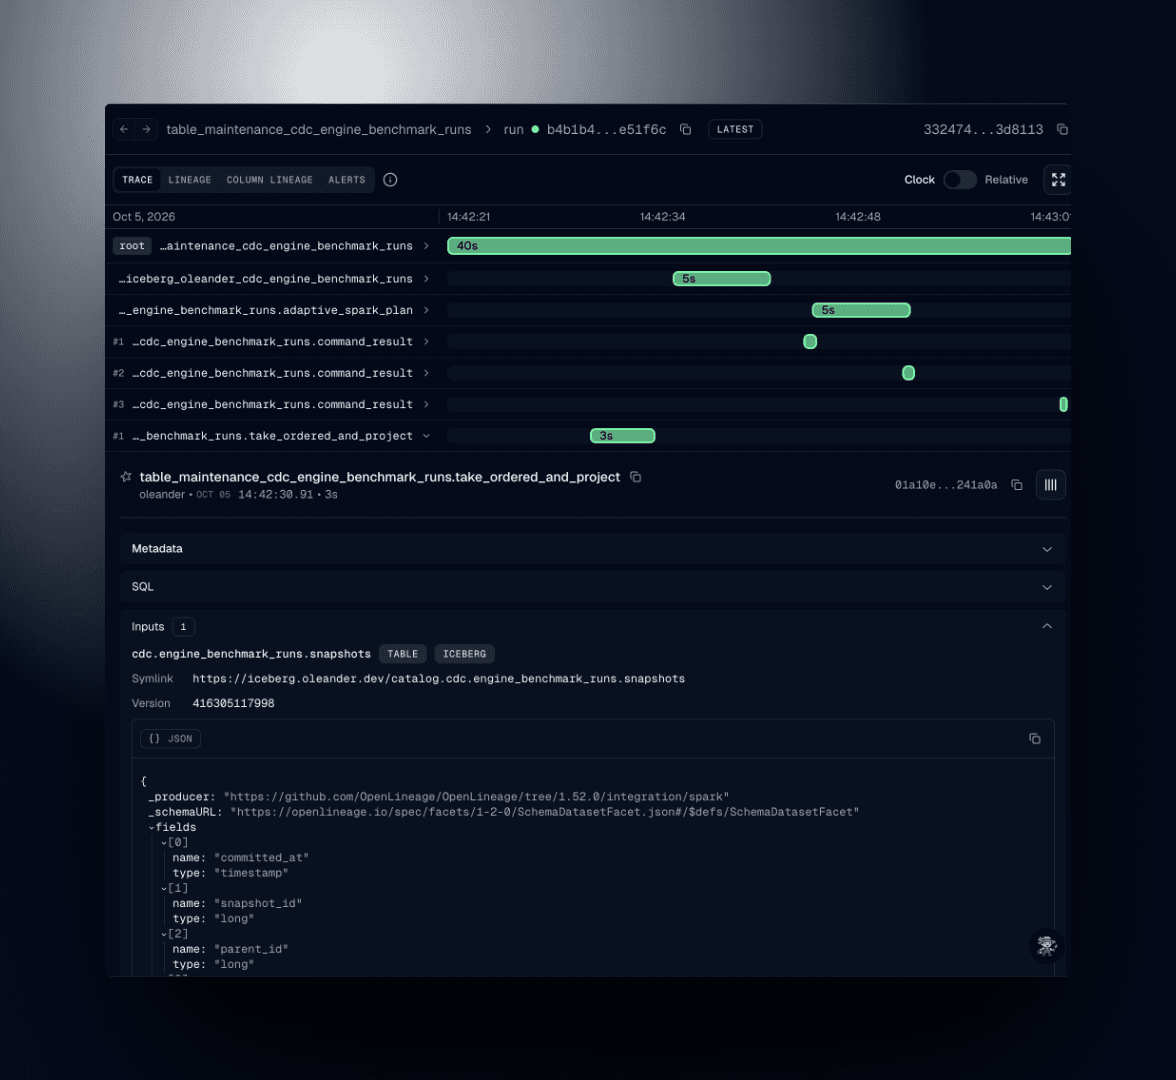
In fact, we tell you exactly how much it cost, without the petty morality of POUs (Price Obfuscation Units), when you look at the run that did the work. This one cost $0.06, in actual dollars.
The results
Running the exact same query after maintenance:
| Metric | Before | After |
|---|---|---|
| Rows | 1,456 | 1,456 |
| Data files | 52 | 1 |
| Avg file size | 5.7 KiB | 41.9 KiB |
| Total size | 295.9 KiB | 41.9 KiB |
| Bloom query time | 2s | 432ms |
Same rows, 52 files down to 1, about 86% less storage, and the query is ~4.6x faster. (oleander rounded down to 2 seconds) The storage savings come almost entirely from no longer paying for 52 sets of Parquet footers and statistics on top of 28 rows of data each. The dot is is now green instead of amber and all is good in the realm.
Asking benchy
Fresh benchmark data every 6 hours is only useful if someone actually looks at it, and that someone is increasingly an agent user. We created benchy, an agent user whose role is read-only on the cdc namespace, and connected it to OpenCode through the oleander MCP server, running on the worst AI model out there: Big Pickle. It's so bad it's free due to its abacus based architecture, but still capable enough to get a correct result. Every query benchy runs is attributed to benchy in the audit trail. benchy can read every benchmark table Artie lands, but it can't write to them, drop them, or see anything outside cdc.
Then we asked it a question that would otherwise mean writing a query against the CDC tables ourselves:
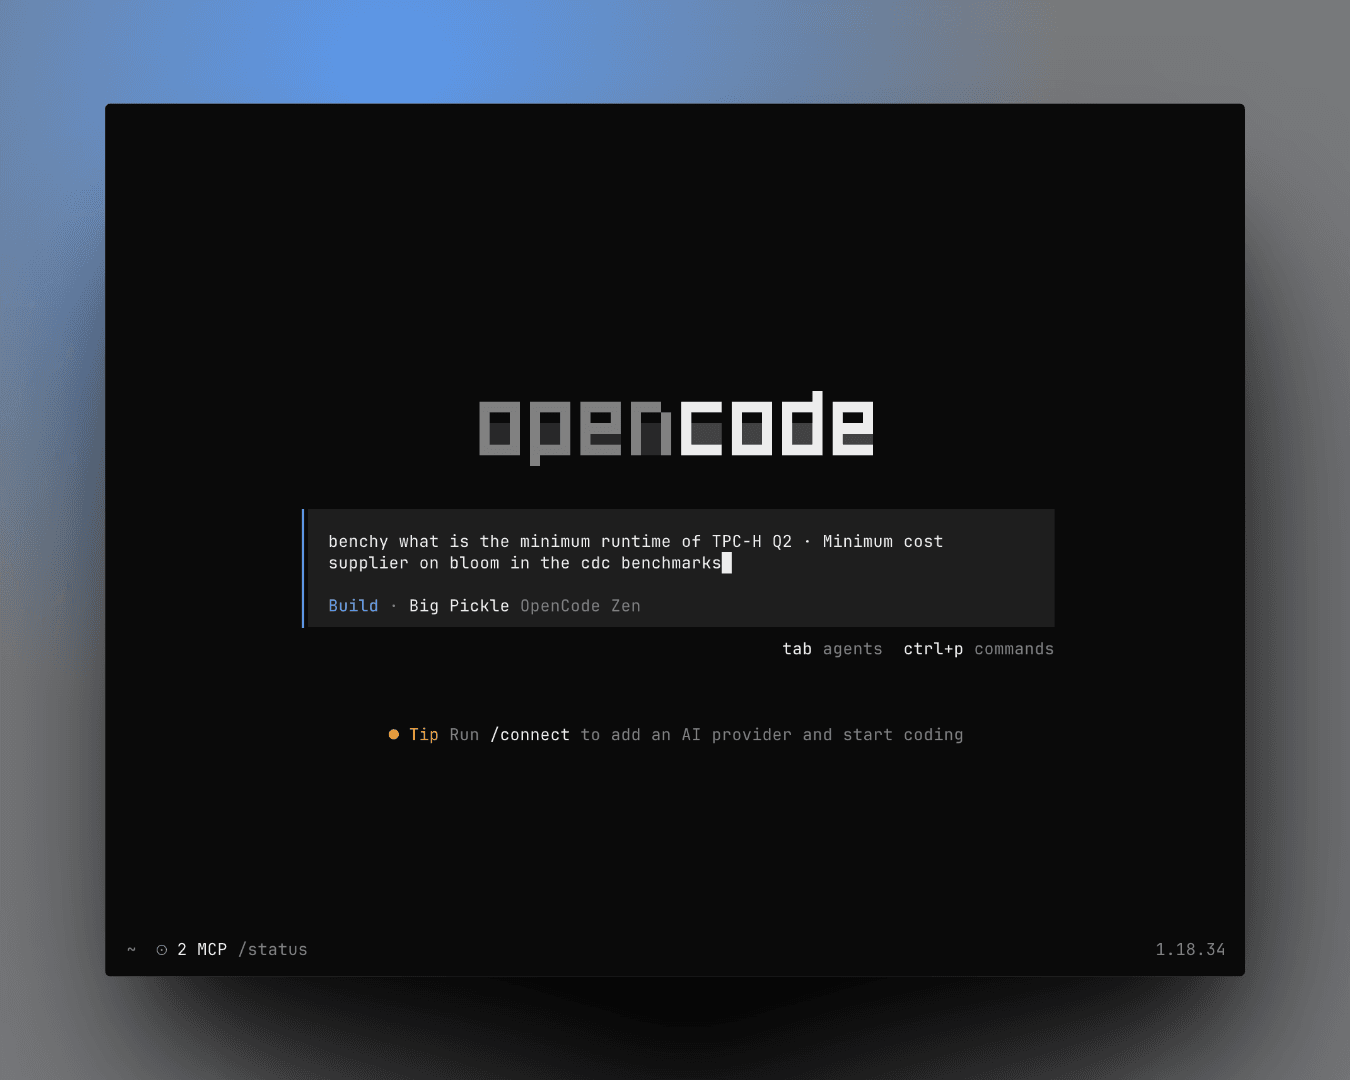
benchy found the benchmark tables in oleander.cdc, queried the runs, and came back with an answer plus some context around it:
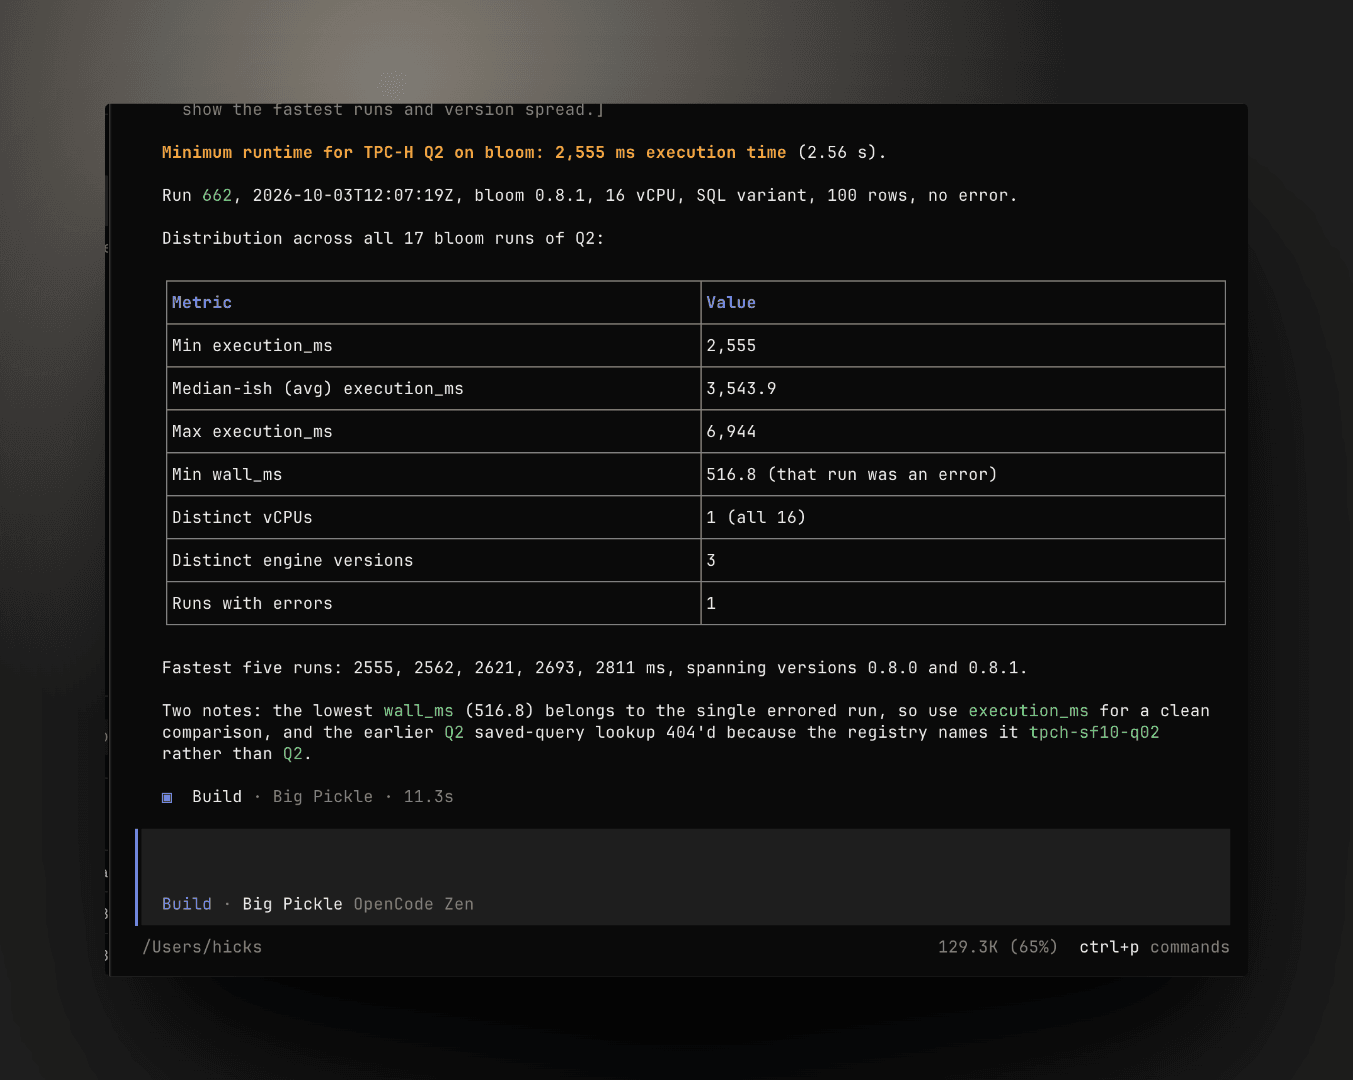
- The fastest Q2 run on Bloom was 2,555 ms of execution time (run 662, Bloom 0.8.1, 16 vCPU)
- Across all 17 Bloom runs of Q2 the average was about 3.5 s and the slowest was 6.9 s, and the five fastest runs span both 0.8.0 and 0.8.1
- When its first lookup for
Q2404'd, (since this is not the smartest model out there) it found the registry name (tpch-sf10-q02) and kept going
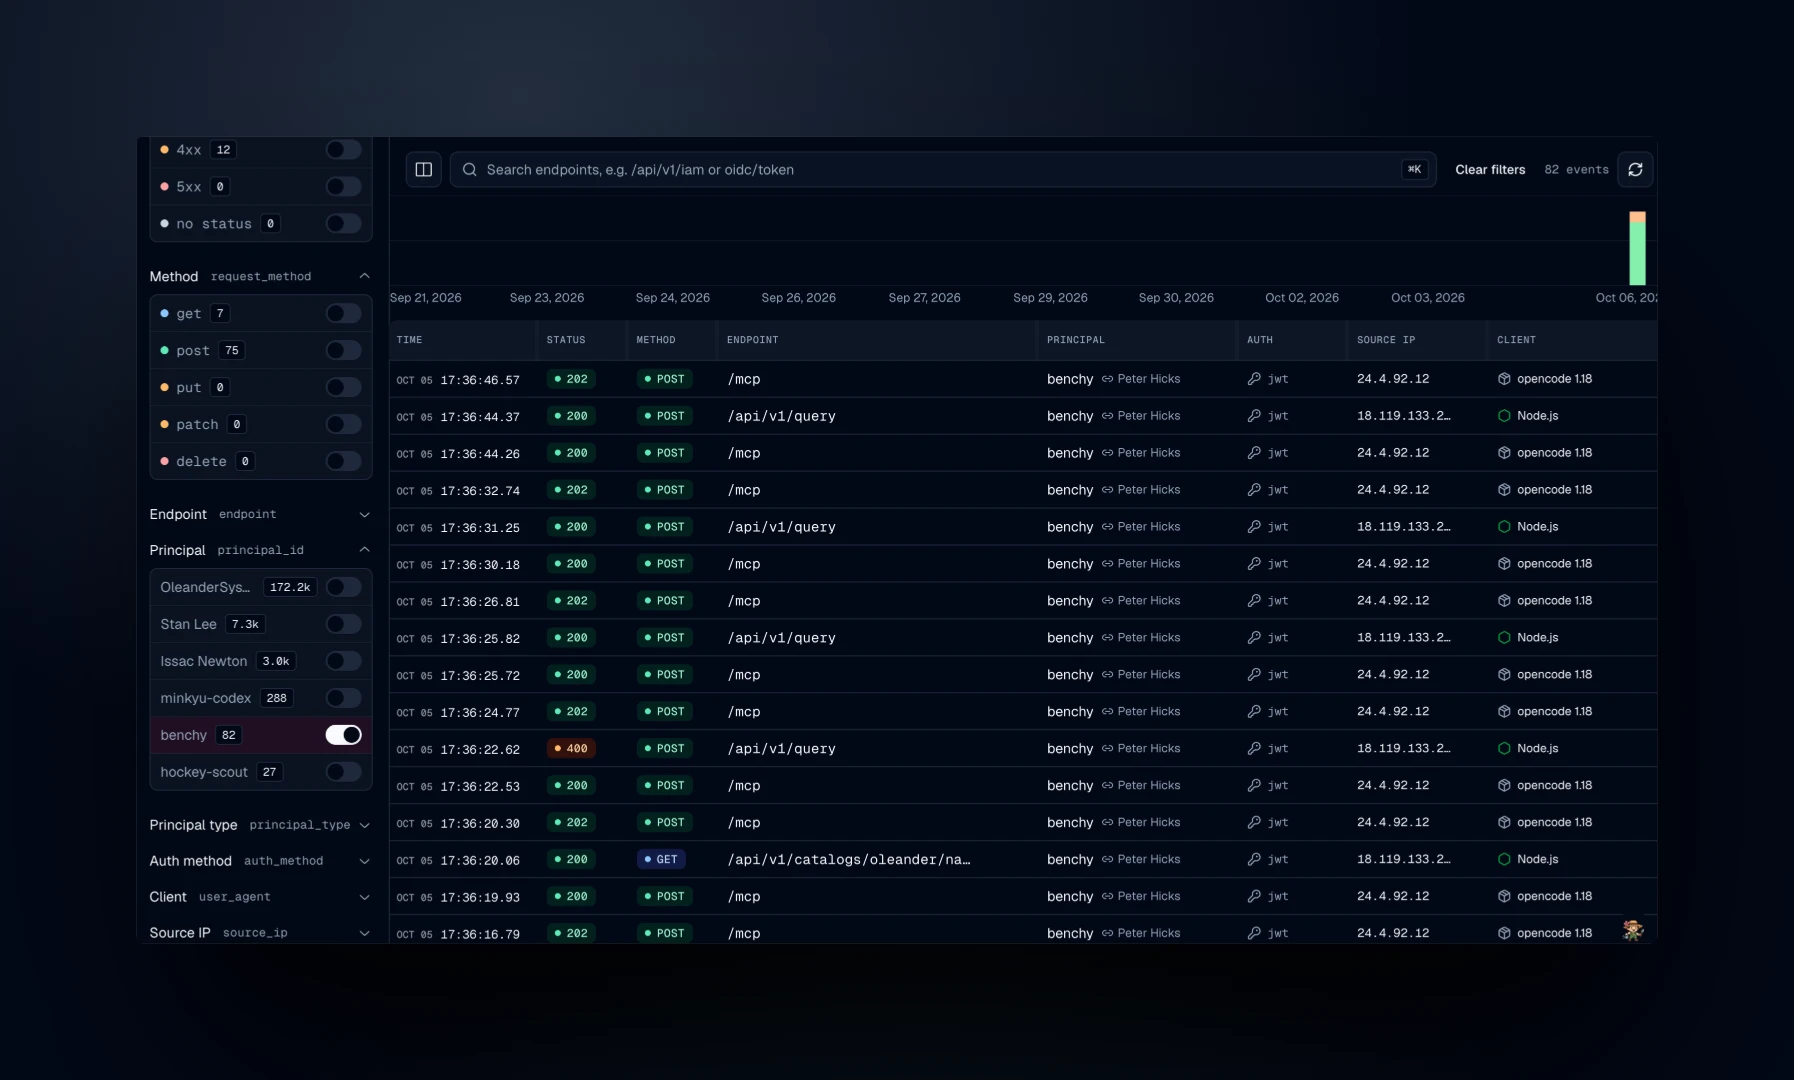
Every step benchy took along the way is in the audit trail. Filtering by the benchy principal shows all 82 requests from that one question: the /mcp calls from OpenCode, the /api/v1/query and catalog calls the MCP server made on benchy's behalf, and the single 400 from a query that didn't make it (because this model is not the best at writing SQL and introspecting schemas). Each row records benchy as the principal, linked to the human who owns it, along with the auth method, source IP, and client.
TLDR
CDC gets your operational data into the lake within the fleeting moments of life. Keeping that data performant over time can be a separate job, and it's one most Iceberg catalogs leave to you. With Artie writing into oleander, we get the real-time replication, the table health checks, the scheduled maintenance jobs, the lineage and cost of those jobs, and an agent that can answer questions about the data without total impugnity to destroy your warehouse, all in one place.